Reporting
Access Level
All users can access personal reports. Group reports require Reviewer or Owner role.
Overview
Filters and Export
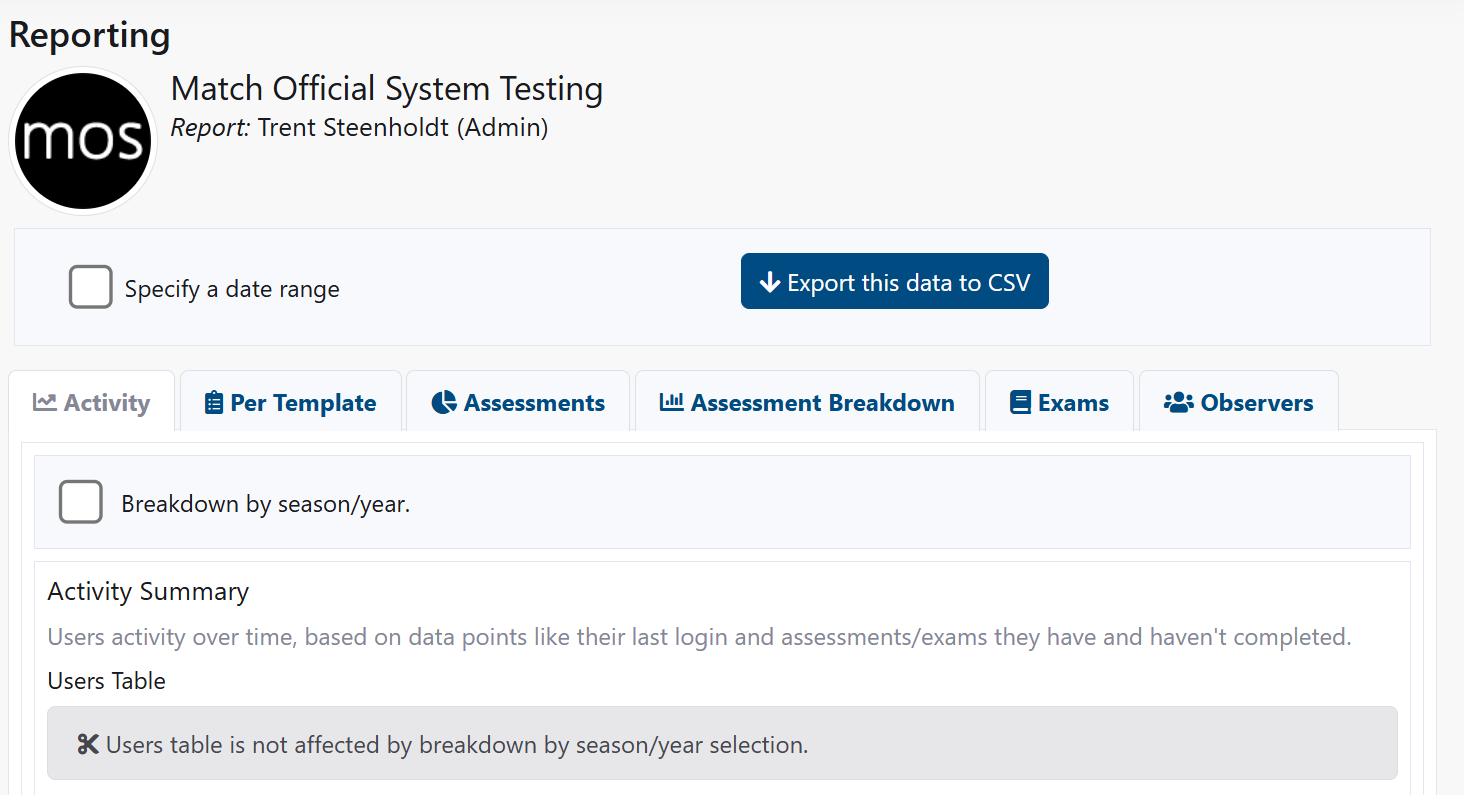
Control the time window and export the current view.
Date Range
- Tick Specify a date range.
- Enter Start and End dates.
- Click Refresh to update charts and tables.
Export to CSV
- Click Export this data to CSV.
- A CSV file downloads with the current report data.
Tips:
- Use smaller date ranges to focus on recent activity.
- Refresh whenever you change date inputs.
Tabs and Reports
Navigate the tabs to explore different insights.
Activity
- Shows last logins and overall activity trends.
- Optional: Breakdown by season/year to see year-by-year trends.
How to use:
- Open Activity.
- Toggle Breakdown by season/year if needed.
- Review the Users Table and Activity Charts.
Per Template
- Focus on a specific assessment template.
- Choose Diary, Match Day, or Peer, then select a Template.
- See Template Details Data and Template Ratings Data.
How to use:
- Open Per Template.
- Select Diary, Match Day, or Peer.
- Choose a Template from the dropdown.
- Review charts for details and ratings.
Assessments
- Summary of assessments and plans across their lifecycle.
- Affected by the selected date range.
How to use:
- Open Assessments.
- Adjust the date range if required.
- Review summary charts.
Assessment Breakdown
- Detailed breakdown of totals, types, and reviewed diary entries.
- Optional: Breakdown by season/year.
How to use:
- Open Assessment Breakdown.
- Toggle Breakdown by season/year.
- Review detailed charts.
Exams
- Tracks exam attempts, scores, and pass rates.
- Optional: Breakdown by season/year.
How to use:
- Open Exams.
- Toggle Breakdown by season/year.
- Review exam charts.
Observers
- Analyze observer feedback and engagement.
- Optional: Breakdown by season/year.
How to use:
- Open Observers.
- Toggle Breakdown by season/year.
- Review observer charts and notes.
Common Tasks
Export Recent Activity
- Click Reporting.
- Tick Specify a date range and set the last 30 days.
- Click Refresh.
- Click Export this data to CSV.
Review a Specific Template’s Performance
- Click Reporting.
- Open Per Template.
- Select Diary or Match Day.
- Choose the relevant Template.
- Review Details and Ratings charts.
Check Exam Outcomes for the Season
- Click Reporting.
- Open Exams.
- Tick Breakdown by season/year.
- Review trends and pass rates.
Troubleshooting
No data displayed
- Try expanding the date range.
- Ensure you clicked Refresh after changing inputs.
Charts say no statistical data found
- Confirm the filters include a period with activity.
- Check if the selected template has recorded results.
CSV export missing rows
- The export follows the current filters; widen the date range.
- Ensure you are in the correct tab for the data you expect.
Related Pages
- Group Reporting - Admin-level, with user filter and raw exports.
- Levels of Access - Who can access reporting features.